21st August 2021
TIL
Histogram with tooltips in Observable Plot
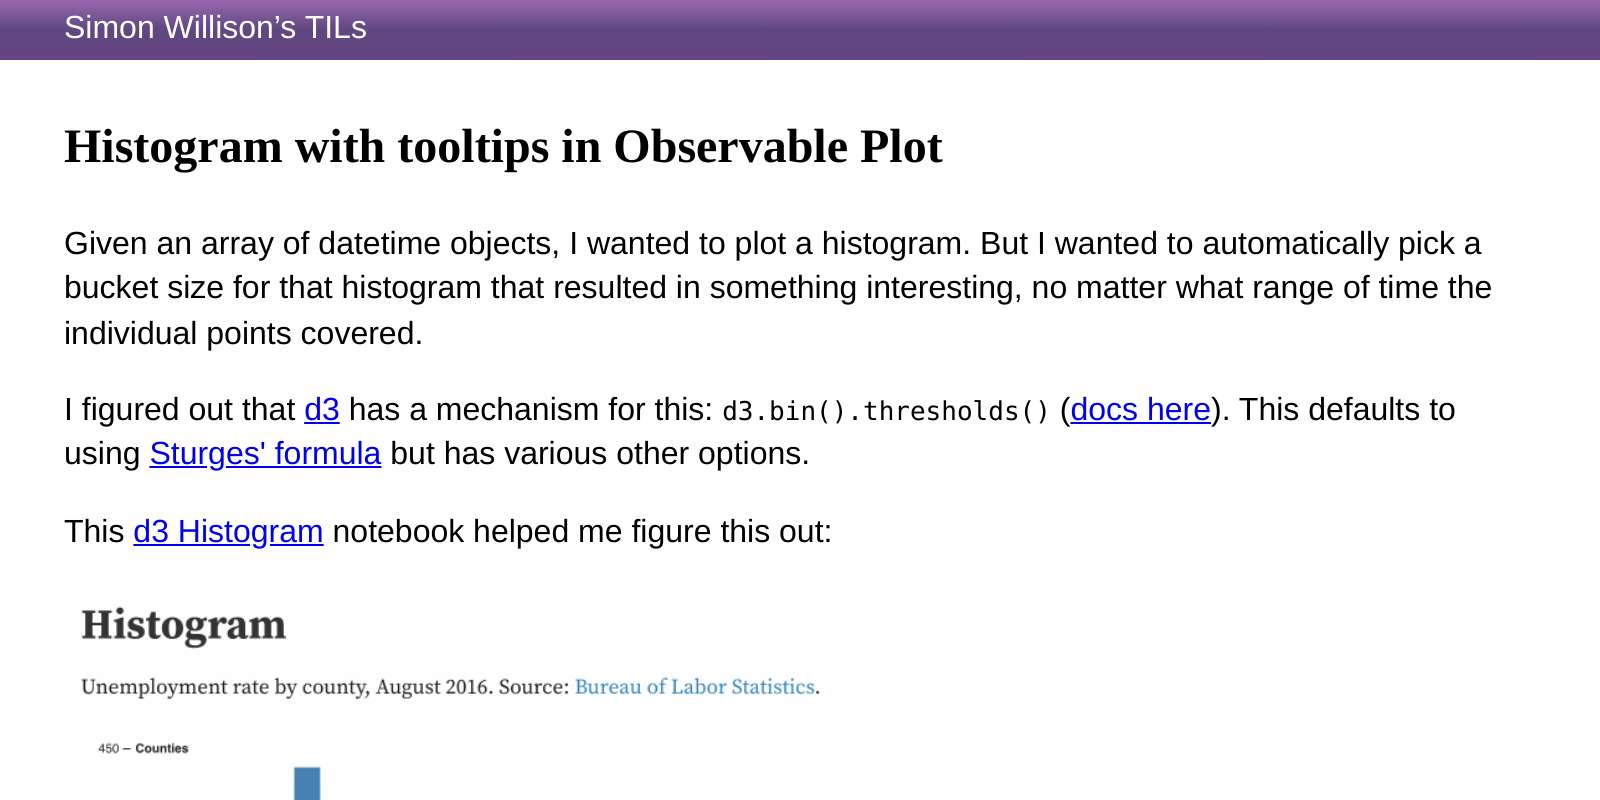
— Given an array of datetime objects, I wanted to plot a histogram. But I wanted to automatically pick a bucket size for that histogram that resulted in something interesting, no matter what range of time the individual points covered.
Recent articles
- Porting the Moebius 0.2B image inpainting model to run in the browser with Claude Code - 22nd June 2026
- sqlite-utils 4.0rc1 adds migrations and nested transactions - 21st June 2026
- Datasette Apps: Host custom HTML applications inside Datasette - 18th June 2026